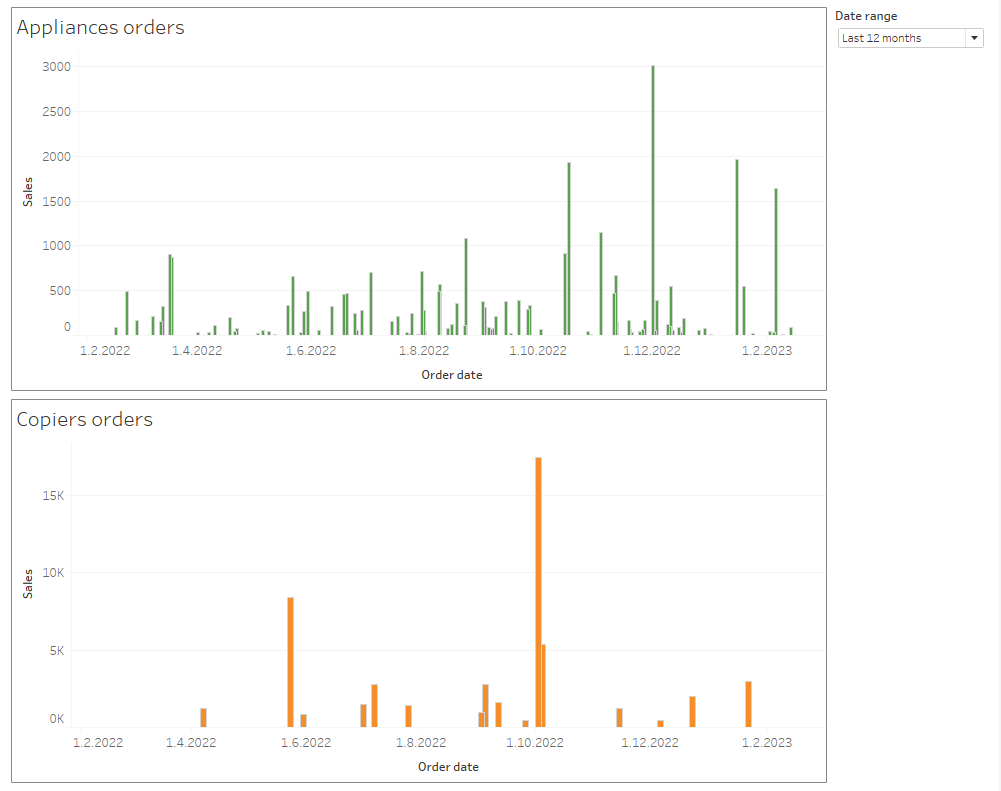
Sometimes there is a need for displaying extended date ranges for visualisations. This can happen in cases, when two time intelligence graphs are visualised simultaneously and perhaps compared to each other. For instance in this dashboard it can be confusing, that the date range for copiers and appliances is different, because copiers are not bought as often as appliances.
Another use case for this could be the visualisation of future dates, where no data exists yet. For example you might have a case when you want to display dates for the whole week, even when you have data only for Monday.
This can be achieved by outer joining the data to a date table, but this solution can lead to large and complex dataset, which can hinder performance, especially if the date table would need to include timestamps as well.
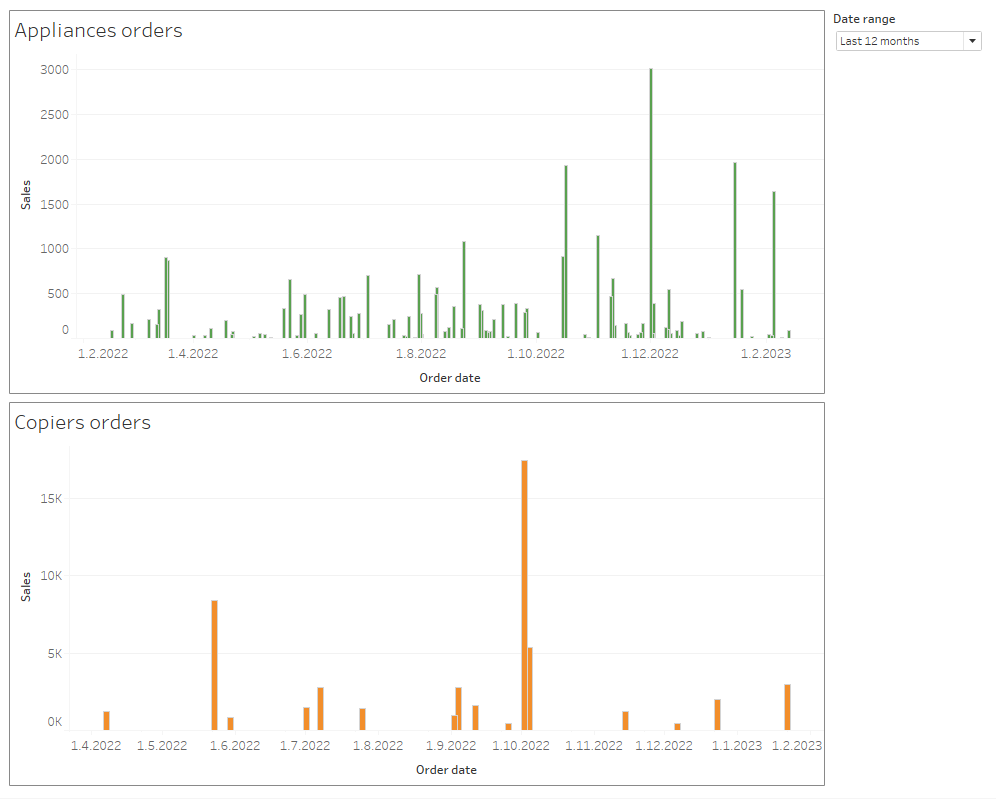
If joining the data to external date table is not possible, one simple solution to the problem is using invisible reference lines. These reference lines are placed at the latest and earliest timestamps in order to get the correct date range visualised.
Here are the steps for creating this solution:
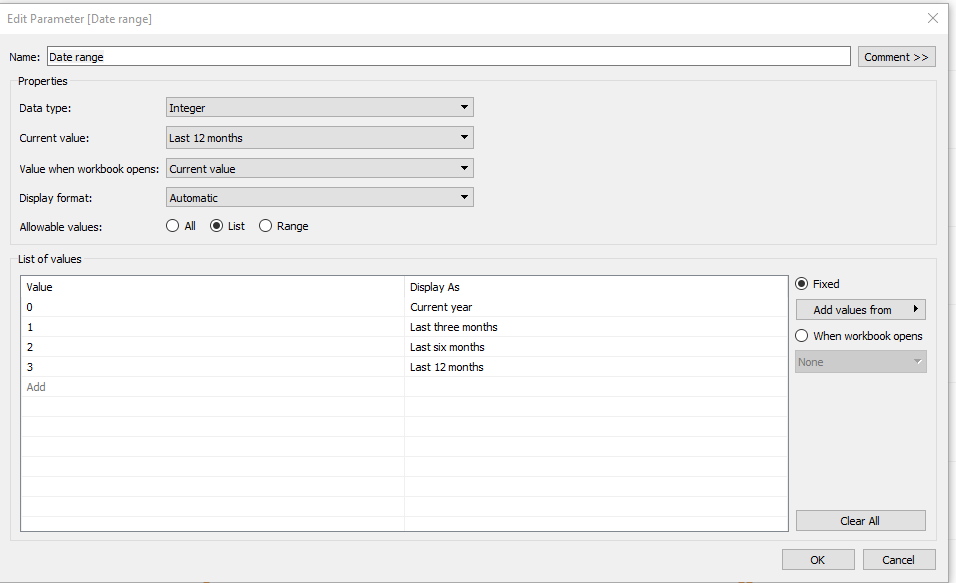
- Create a parameter for the date range. You can use date parameters for the earliest and latest dates, or a parameter to choose a date range like below.
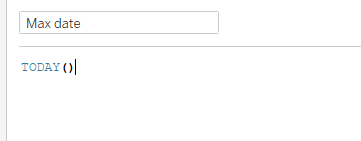
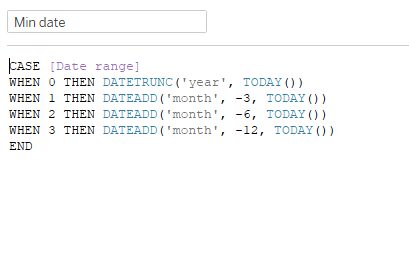
- Create calculated fields for the earliest and latest dates.
Maximum date is the current date in this example, but if you used a date parameter for the max date, use the value from the parameter.
Minimum date is set according to parameter selection relative to current date.
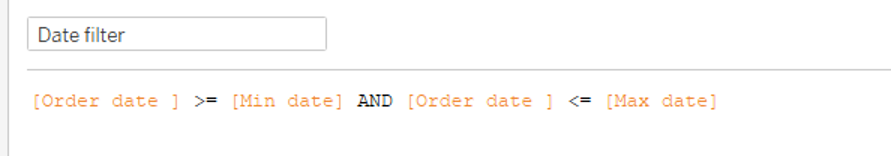
- Create a date filter to filter out any timestamps which fall out of the selection, and place it on the sheets with timeline visualisations.
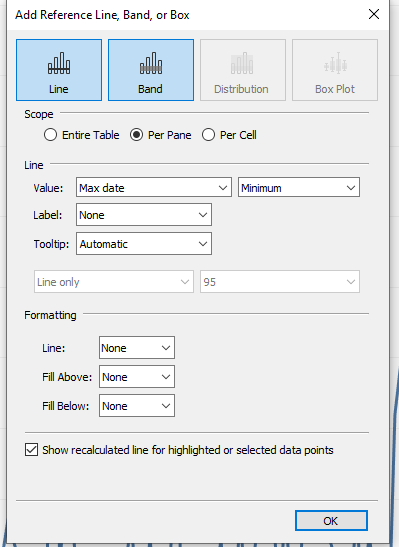
- Add your calculated fields for maximum and minimum dates to ‘Details’ on the marks pane of your visualisation in Tableau, and set them as reference lines to your date axis.
- Format the reference lines to be invisible by selecting ‘None’ as ‘Line’, ‘Fill Above’ and ‘Fill Below’.
- Repeat steps 4 and 5 to other time intelligence graphs, if needed.
- Create the dashboard, display your timeline parameter, and you are ready!